CPU Load not always correct

Hello
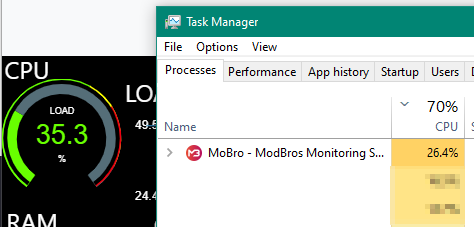
I notice that the CPU load on Mobro on my Surface Book 3 is almost always incorrect. There is no real pattern that I can see. Sometimes Mobro reports 30 %, and the CPU is at 100%. Sometimes MoBro is within a small margin of the correct CPU load reported by Task manager. This is the case with librehardwaremonitor and openhardwaremonitor.
Is there anything I can do to fix this?
Hey @DavidTango,
We only show the data that we are getting from the data-plugins, you could try to use HWiNFO on your system. Maybe it will read the data more exact. Here is a link to the FAQ to get it working.
I tried hwinfo today. It is pretty much the same as libre and openhardwaremonitor.
I wonder if it is the difference between the percentage of total available compute, vs the throttled (due to temperature) available compute. This is running on a Surface Book 3, and I know it does throttle from high temperature. Either way, the task bar is usually reporting higher than what Mobros displays.
Another possibility is that librehardwaremonitor, openhardwaremonitor, and WHiNFO are only showing the host compute %. I have multiple VMs on the Surface Book 3, maybe their compute % is not reported to the hardwaremonitor tools?
Thanks
David
I'm not sure if Windows Task Manager is trustworthy at the moment.
I came across a similar problem some days ago.
Two Docker containers which use 30 out of 36 cores on Windows. Both containers running a stress test and consuming 100% of their cores.
This would mean a CPU load of total 83.33%.
While Docker stats did show the correct usage, Windows Task Manager was showing about 35%.
Probably we should investigate some time to cross check with multiple tools to see what the actual problem is - Windows Task Manager or the other tools.
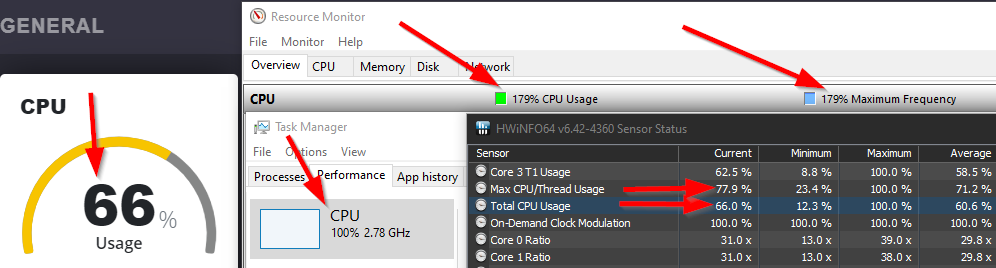
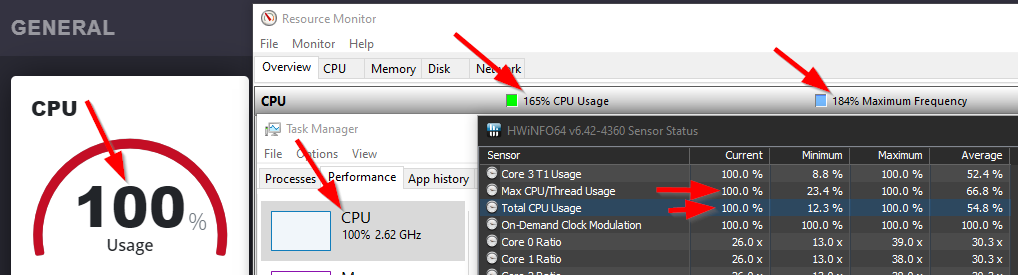
Yes, that is where I am at, not sure if all 3 of the monitor tools are incorrect, or if Task manager is incorrect. Occasionally, both Mobro and Task Manager reports 100%, and during that time, yes, the system appears fully under stress. At other times, Task Manager reports 100%, while the Mobros UI is saying as little as 15%, which is a huge difference.
Resource monitor is all over the shop, sometimes reporting nearly 200%.
It seems like when asking what load the CPU is under at a point in time, the answer is “it depends who you ask”.
FYI, I just installed ProcessExplorer (Mark Russinovich), and it pretty well agrees with all three options in Mobro. So I am just going to call it that Task Manager CPU utilisation is broken. I am happy to believe what Mobro displays.
Thanks
David