Names missing in old themes

Hi, love the new update and the new way of getting info from hw.
I've run in to an issue though which worked fine before the update.
I can't get any names on of the components which are being monitored. This is for the default theme and the fallout theme.
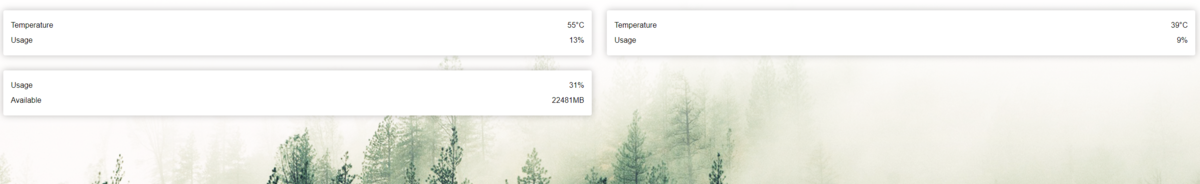
On the dubbadhar theme the names are getting there, but im running it the official raspberry pi 7" touchscreen and there are some cropping issues, any way to fix this? I've tried zooming out but its not letting me zoom out all the way.
The pi touchscreen is running at 800 x 480, 5:3.
Thank you!!
Just send the email..thanks for the quick reply..you all done a great job on this one..GhosTz blog.reply.wrote:
I've just updated the dubbadhar theme to fix the scaling issue. It will ship with the next version. If you want to fix it yourself right now you can download the open source theme here:
https://github.com/ModBros/mobro-theme-dubbadhar
and move the files inside the theme directory that should be something like this:
C:\Users\<UserName>\AppData\Local\MoBro\app-1.0.0-beta1\resources\resources\public\theme\dubbadhar
If anyone tries this please tell me if it fixes the scaling issue on your side.
~ Mike
Hi,
yes its fixed....
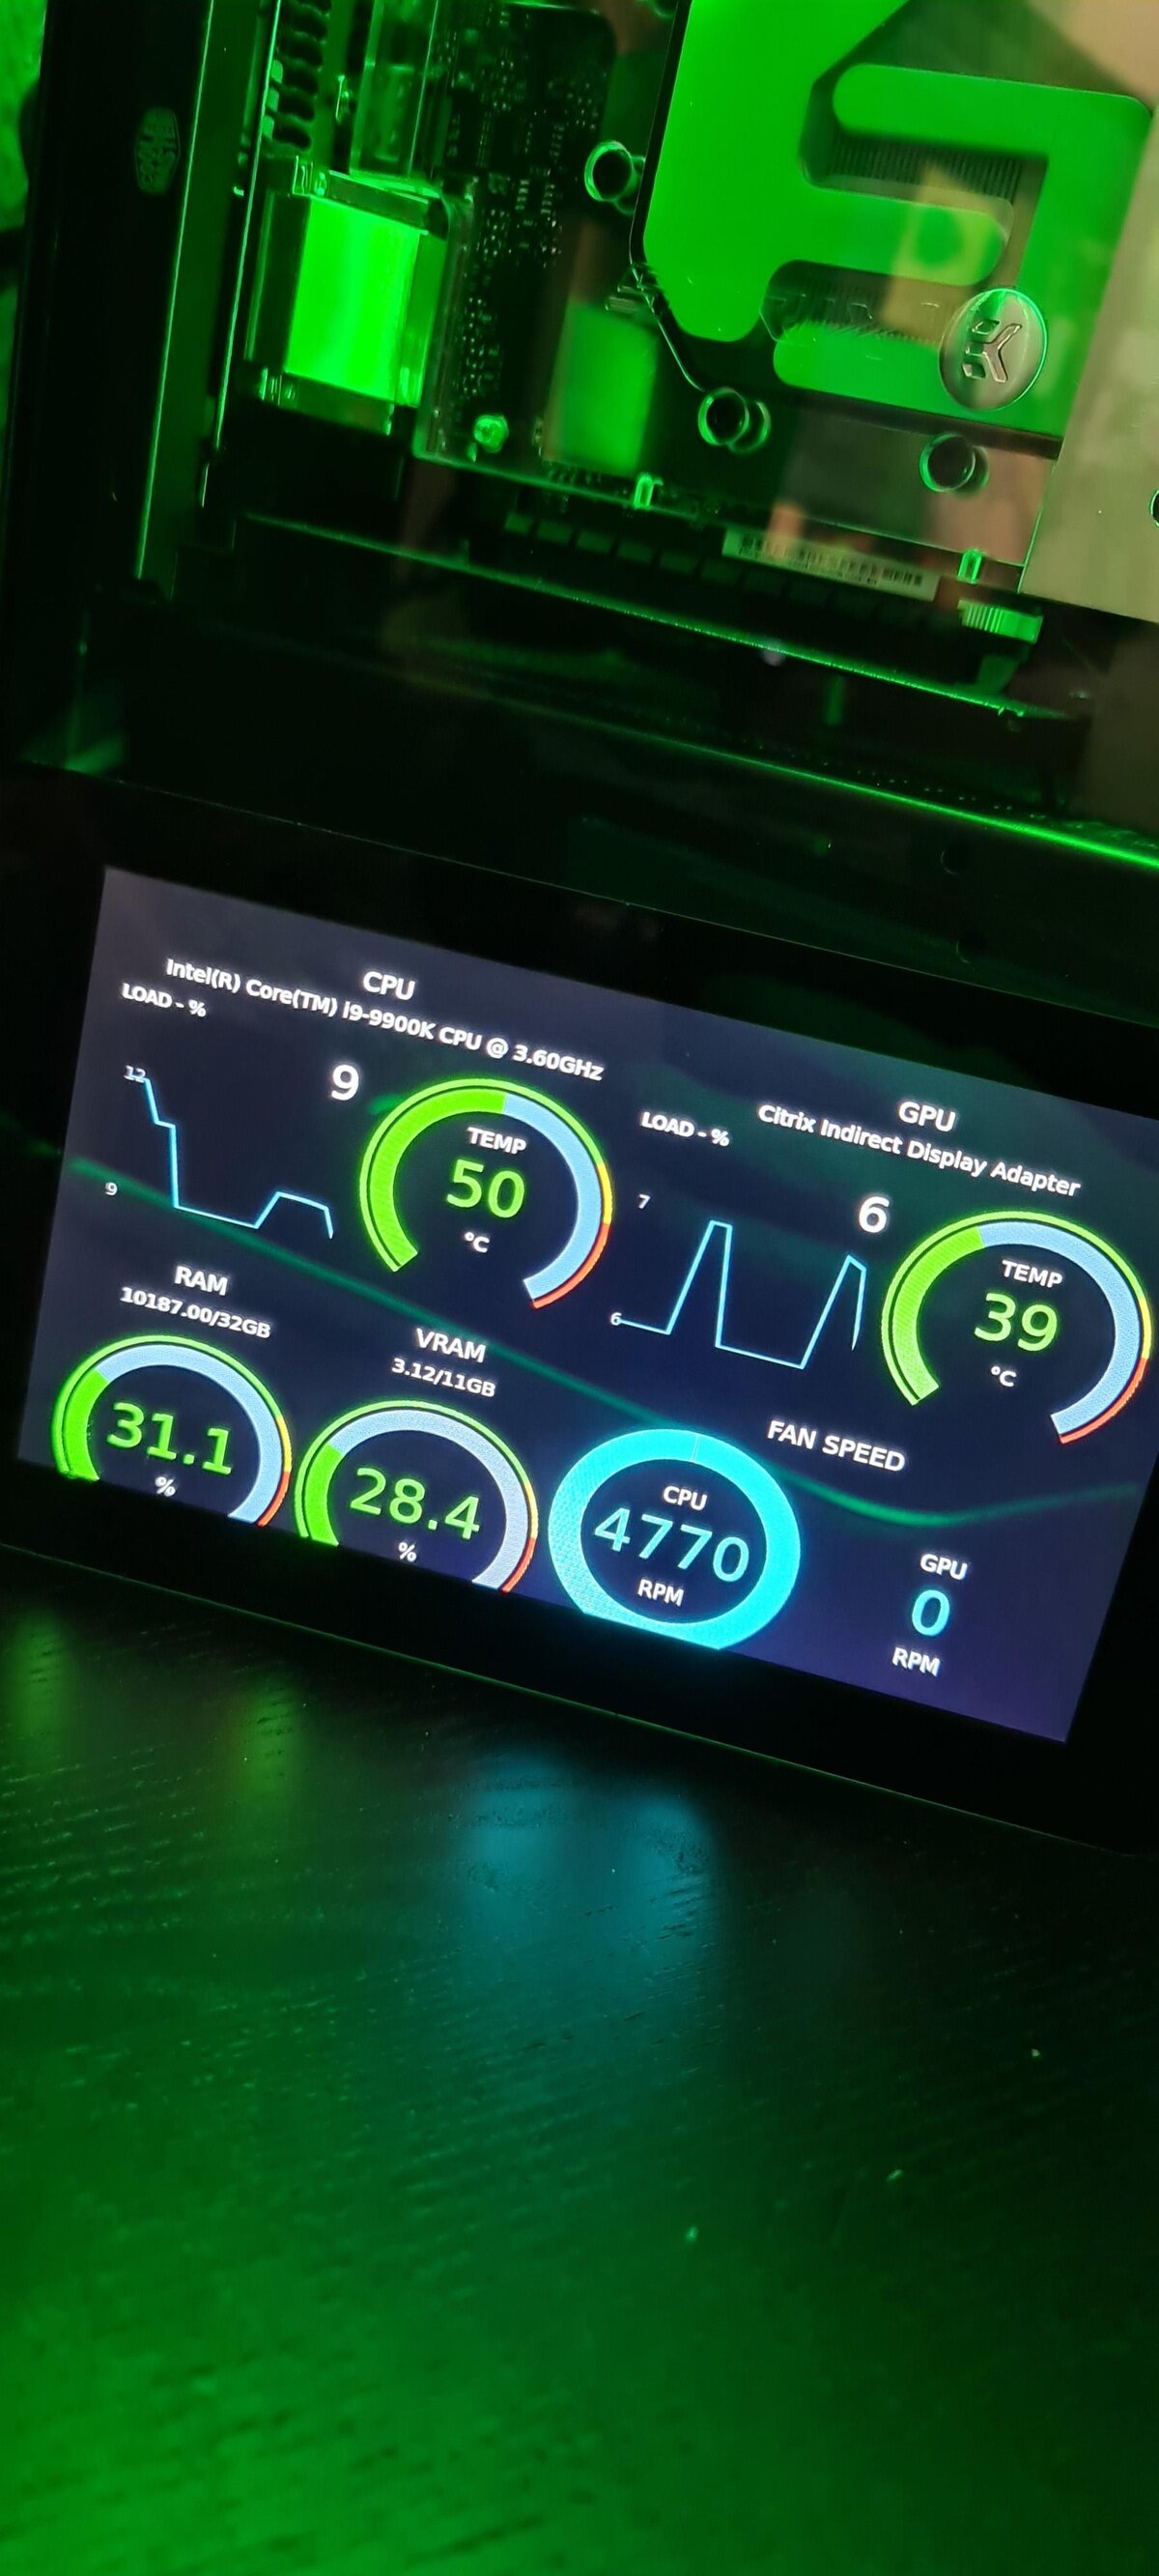
great to see it working! Now on to the next one. I'd love to solve the NaN Issue that I can see here in your screen. Could you send me an email to info@mod-bros.com and paste me what you get when you navigate to http://localhost:42001/api/sensors/data in your browser? Because I think it might be too long for the forum :P


Hey @MrSpoon could you also send us the http://localhost:42001/api/sensors/data to our email info@mod-bros.com so we can take a look at it.
@melua02 we have figured out the problem and we might be able to provide a hotfix for Ryzen Zen2 (maybe beginning next week).
In the next major update we'll add a new feature to define what values will be used for themes so you will be able to fix it yourself if we cannot match the values.
Email sent.
Hi, did you do something guys??? Now my display shows everything correct.. i dont know why but it works for now :D
Suddenly this morning I have no CPU Fan gauge it's totally missing from the :41200 and the pi screen also the load graphs were frozen on both CPU and GPU loads.
I have to "F5" refresh the browser to get them working again on :42100, i wonder if something similar needs to happen with the Pi?
Suddenly this morning I have no CPU Fan gauge it's totally missing from the :41200 and the pi screen also the load graphs were frozen on both CPU and GPU loads.
I have to "F5" refresh the browser to get them working again on :42100, i wonder if something similar needs to happen with the Pi?
Hey MrSpoon, when you get a freeze in the browser again, could you please open the dev tools (usually CTRL + SHIFT + I, or just F12) and check the console tab and send us a screen shot? Smells like an issue with the theme.
~ Dave
Hey guys,
thank you for your emails - we have taken a closer look at all the data and we'll do some adjustments next week.
@melua02 we didn't change anything yet. It might be an update from HWiNFO. Great to hear that it works now! If you want you could send me the working sensors output so we can compare what changed.
@MrSpoon as far as I can tell HWiNFO and the other two libraries have no info about the total VRAM of the amd graphics cards (I also tested with a 5700XT and no luck). Since they don't have the total I cannot create a gauge because I don't know the percentage. And also the total value cannot be displayed.
Right now I cannot do much about that just hope that HWiNFO will be able to read the data in an update at some point. You could try asking in their forums about that issue.
What we will do about that is that we'll keep on working on how Themes are working and there will be customization at some point so you can choose what data should be displayed dynamically and then you can just remove VRAM if you are not getting the data (cause there is not much we can do).
Soon you will also be able to match the data from all sources to our internal channels so that if we get the mapping wrong (the guessing that we have on what data is what) - you can fix it :)
~ Mike
No problem, wasn't to worried about the Vram reading as I saw none of the monitors saw the total vram. It will be extra awesome to be able to swap out gauges :)
As of this morning the only gauges updating on the Pi are CPU load % ,GPU load % values but no graphs, and the GPU temp. All other values appear stuck and the CPU fan gauge is graphically missing all together...
I'm pretty sure I have the 8.7 pi image... is there a version file I can check via SSH? perhaps I'll reflash the sd card.
@MrSpoon I guess you have had your pc running over night? So could you do me a favor and check the processes on your pi, maybe we have a memory issue on our end. You can check them via an exposed api over the network:
http://[IP OF YOUR PI]/api/top/
You can check the Version of your pi with:
http://[IP OF YOUR PI]/version
Ok, it might be my bad...
/verison shows 8
I'll reflash the card.
Top shows:
Chromium using 39.6% of (1gb ram pi3) of 5 processes.
Version 8 should be fine. 40% is a lot but should be fine.
Could you try switching the theme to default and after that is loaded go back to the dubbadhar and see if that works?
Thank you for your help!
So switching to default the 5 chromium use 50%
Then switching back to Dubbadahar theme it's now 52%
I'll reflash and test again. My machine never shutsdown and in theory never should the Pi as it's mounted in my case.
SO I grabbed "mobro_v8.7z" from google drive but when extracted the folder is "mobro_v8" and I still get "8" when I look at /version in the browser.
Now chromium shows 37.4% total.
Wait... ignore that about the pi image... having one of those visual days... 8.7z I kept reading it as 8.7.... the version should be 8.. LOL sorry.MrSpoon blog.reply.wrote:
SO I grabbed "mobro_v8.7z" from google drive but when extracted the folder is "mobro_v8" and I still get "8" when I look at /version in the browser.
Now chromium shows 37.4% total.
Oh yes .7z is the file ending of 7zip :P
How does your Theme look now?
Well I got my CPU fan gauge back...
but the temps aren't coming through and the RAM used % is not working. also still no load graphs.
those shows in the web

Okay that's so weird.
So the values like load of cpu and gpu are updating, right? But the Graphs of them also don't update? So that must be a JS issue
Hope this ehlps.

Alright, so we were just scratching our heads for the past hour to figure out how this is possible.
So we came up with another approach see what's going on there.
But that will require you to connect to the Pi via SSH and execute some commands.
Just execute them in this order:
- sudo service modbros stop
- sudo xinit /bin/sh -c "exec /usr/bin/matchbox-window-manager -use_titlebar no -use_cursor no" -- -nocursor &
- wait a few seconds and just press enter to get back to the command line again
- DISPLAY=:0 chromium-browser "http://<IP_OF_YOUR_PC>:42100?version=8&uuid=dca63207c667&name=Testing" --kiosk --enable-logging --log-level=0
- wait for the theme to load on the Pi and let it run for a few seconds
- press Ctrl+C to stop chromium
- cat /home/modbros/.config/chromium/chrome_debug.log
And then please post or send us the returned log of the last command
If you encounter difficulties, just tell us.
Or you could also join us on discord if you want to so we can sort this bug out
We've found the issue!
After debugging some hours with @MrSpoon (thank you for your patience and help!) we have finally found the error that causes the charts to not update or stop updating after a while. It is a theme issue in the dubbadhar theme and you can find the fix in the GitHub Repository. We will add this fix in the update next week!
If you want to fix it yourself right now you can download the theme:
https://github.com/ModBros/mobro-theme-dubbadhar
and move the files inside the theme directory that should be something like this:
C:\Users\<UserName>\AppData\Local\MoBro\app-1.0.0-beta1\resources\resources\public\theme\dubbadhar
~ Mike