Memory Leak in ModBors Monitoring Service

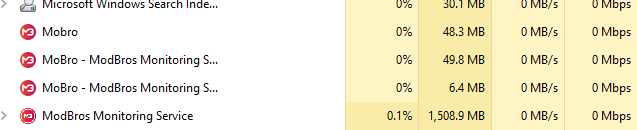
Just curious if you are aware that you have a memory leak in this service. It starts with 36MB of memory used, once it has been running a day it has already consumed nearly 2GB of memory. This left unchecked will consume most peoples available memory in a few days.
Hey @Rizlah,
thanks for posting this issue, we'll have a look at that.
Having the same problem.
Hey @Rizlah @Jarlsburg,
Could you please provide me some answers that could help me pin point the issue:
- Which version of MoBro are you using?
- Could you provide a screenshot of the task manager if the memory leak occurs?
- Do have a rasperry connected?
- Could you ZIP the <drive>:\Users\<user>\AppData\Local\MoBro_Local folder, upload it somewhere and provide me a link to the file?
At the moment I can't reproduce the issue on my side.
I too have noticed the RAM usage spiking.
Rpi 3 usually connected 24/7, that said Beta6/7 have been causing the pi to either dispaly “Oh snap” or a solid white screen and require the unit to be power cycled every few days or so.
https://www.dropbox.com/s/m3nn74spkv6oo7h/MoBro_Local.7z?dl=0
Hey @Rizlah @Jarlsburg,
Could you please provide me some answers that could help me pin point the issue:
- Which version of MoBro are you using?
- Could you provide a screenshot of the task manager if the memory leak occurs?
- Do have a rasperry connected?
- Could you ZIP the <drive>:\Users\<user>\AppData\Local\MoBro_Local folder, upload it somewhere and provide me a link to the file?
At the moment I can't reproduce the issue on my side.
Heya,
I can reproduce the issue too.
- 1.0.0-beta7 is the version of the desktop app
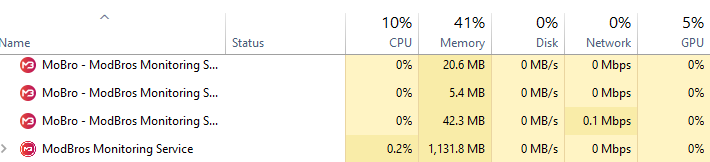
- I'll whack a screenshot on. It's after having the PC on for a whole workday and a bit.
- The RasPi has been connected all day
- Zip is at the Google Drive link below.
Hope that's useful :)
- Ally.
https://drive.google.com/file/d/1Kk1dV0fP7E8Oxl1SOF1fwgZCyf9UDDrp/view?usp=sharing

Just to confirm the issue I see is not using raspi but I do have a browser open to the monitor on my iPad.
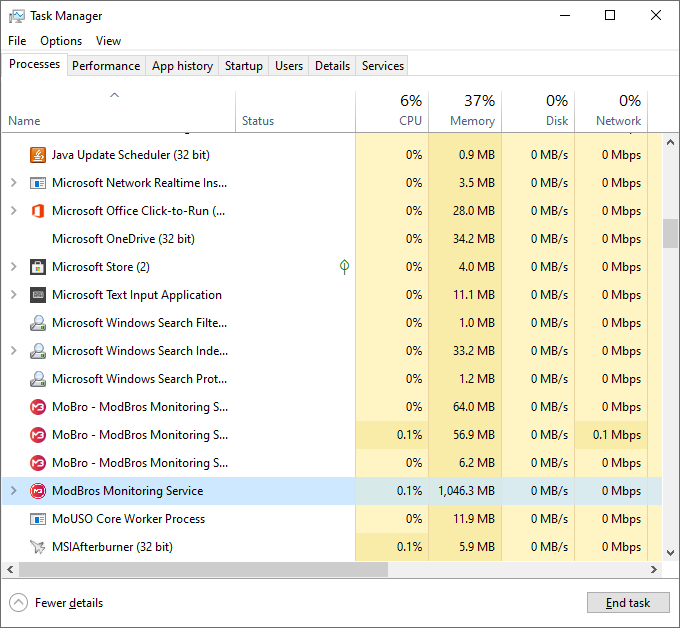
@Dave Sure. Here's my folder and a screenshot after about 24 hours.
Which version of MoBro are you using?
- 1.0.0-beta7
Could you provide a screenshot of the task manager if the memory leak occurs?
Do have a rasperry connected?
- Yes, I am using a RPi3B
Could you ZIP the <drive>:\Users\<user>\AppData\Local\MoBro_Local folder, upload it somewhere and provide me a link to the file?
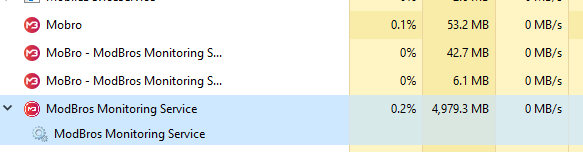
I've also run into this issue. The screenshot below was taken roughly 16 hours after a system reboot. When I first checked the Task Manager after about a week of uptime, MoBro was consuming nearly 5GB of RAM.
Which version of MoBro are you using?
1.0.0-beta7
Could you provide a screenshot of the task manager if the memory leak occurs?
Do have a Raspberry connected?
No, I am using the Android MoBro app on an Amazon FireHD8.
Could you ZIP the <drive>:\Users\<user>\AppData\Local\MoBro_Local folder, upload it somewhere and provide me a link to the file?
https://drive.google.com/file/d/10_HjyjE9-kw1Bn2aR_CGj_MdNpjmHEP8/view?usp=sharing
Thanks for your hard work on such awesome programs!
Thanks all of you guys for providing the data!
We are now also able to reproduce the issue and it seems to only occur when using HWiNFO. But the error is definitely on our side and we're looking into it.
Hopefully we will be able to provide an update with a fix for this soon :)
So, update on the situation:
As I posted previously we thought that we could reproduce the issue. But that turned out to be wrong.. :/
Memory usage in our case always topped out below 100MB and we can't get it to rise any higher. Let alone the multiple GBs you guys have.
So we're still trying to find the cause.. Could you guys please tell us which hardware you are using?
Mainly which processor and graphics card?
AMD 3900x with a GTX 1070 on a Gigabyte X570 AORUS MASTER.
Usage is sitting over 8GB now.
@Seraksab Sure. Ryzen 7 3700X, EVGA FTW3 3070
Ryzen 9 5900x and gigabyte rtx 3070 gaming OC.
For me, it's a Ryzen 3700X, an Asus B550M TUF Wifi, and a Gigabyte RTX3070.
I think I see a trend…. LOL
@MrSpoon Yeahhh, lol.
I think I see a trend…. LOL
Ryzen 3900x using 1.0.0-patreon9, sitting between 130mb and 140mb, PC has been on for over a week, Pi has been on for 4 days.
I see a constant tick of .1 - .3 MB/sec growth from boot.
20hr uptime.