Memory Leak in ModBors Monitoring Service

Just curious if you are aware that you have a memory leak in this service. It starts with 36MB of memory used, once it has been running a day it has already consumed nearly 2GB of memory. This left unchecked will consume most peoples available memory in a few days.
Started testing the “Old version” shortly after you posted it. I usually run it for a long time to be sure it hits over 500 MB. Is that over kill?
~1 hr and its at 101.1 MB
Yeah anything above ~100MB is pretty much too high. It should normally stay way below that.
So you don't have to run it for that long.
Just to confirm its actually the correct version that is running, could you open ‘http://localhost:42001/version’ in a browser and check if it returns 1.0.10 ?
Running ‘http://localhost:42001/version’ returns 1.0.12…
Soooooooo. I stopped the service extracted “Old version” confirmed in file properties that it says 1.0.10, start the service then the Modbros app says “Hey the service is not running, do you want to start it?" say yes and agree to the UAC prompt. Check the file properties and it says 1.0.12…
Oh.. not good ^^
Did you have the same pop-up when testing the versions with open and libre disabled before?
Because I guess the app will re-install the newer version in this case.. :/
Maybe close the MoBro app before switching to the old service and open it again after you restarted the service to avoid that pop-up
yeah I did the prompt restarts with both of the others… So I will retest without it reinstalling itself…
others may have done had similar results.
Looks like the simple act of starting Modbros will replace the service on load up.
Ah yeah makes sense actually.. The updater checks the installed service version on startup of MoBro against the new .exe that comes with the app..
If you go to ‘C:\Users\<USER>\AppData\Local\MoBro\<VERSION>\resources\resources\libs’ there should be another ‘ModBrosMonitoringService.exe’
If you replace that as well with the old version it should work.
Sorry for all the hassle ?
Alright steps I used to get “old version” working
- Close Modbros App
- Stop Service
- Replace service
- Start Service
- Start Modbros App and “NO” to cmdline admin prompts (there are 2 of them)
- Ran ‘http://localhost:42001/version’ to confirm 1.0.10
I'll run the old one for now and see if it creeps, then go back through the 2 new ones.
@MrSpoon Thanks for the steps. I have the old version working as well with the 1.0.10 prompt. Will report back tonight.
~180 MB after about 2 hours running “Old version” not sure if there is a point in testing the newer versions.
Yeah, I am at ~300 after 3h on the old version too.
~180 MB after about 2 hours running “Old version” not sure if there is a point in testing the newer versions.
Well if it's not too much of a hassle for you it would be nice if you could test those as well.
Just to narrow down the error.
If those don't work either than at least we know that it definitely has to be an issue in the main code and not in the part that is reading the data.
For me it would be especially interesting if the version with HWiNFO only works. I'm thinking it might has something to do with this: https://github.com/openhardwaremonitor/openhardwaremonitor/issues/493
And since OpenHardwareMonitor and LibreHardwareMonitor have strong similarities in the base of their code it might affect both of them.
And again, thanks a lot for helping out!
Running the “hwinfo only” version ram for an hr and RAM has sat at a consistent 22 MB, However I'm unable to actually get any gauges to work. Not sure if it's actually polling any data.
Nvm… Must have been a Pre-coffee issue. Re did the steps and have values. will report back.
Well that sounds way better :)
When setting up the gauges, are you able to normally select the values from hwinfo?
You can get all available data via ‘http://localhost:42001/api/sensors/data’
If go to ‘monitordata’ in the returned json you should see all 3 current sources. In your case Open and Libre should return no data, while hwinfo should have quite a lot of values.
I have had the same results as MrSpoon. hwinfo is stable at ~18 on the main process. All gauges are working properly.
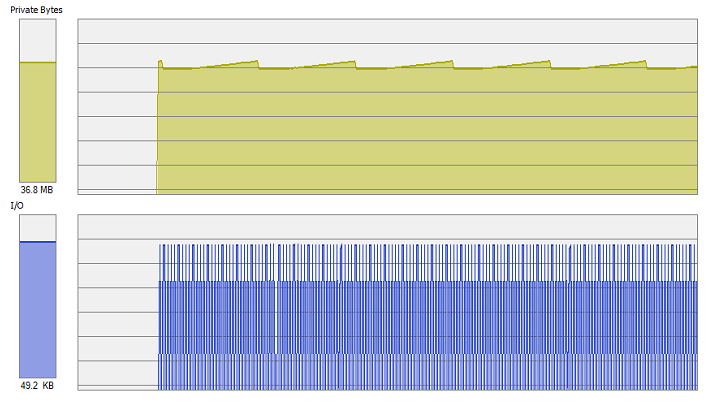
“HWinfo only” versions seems solid. Starts at 17.9MB climbs to 22 MB then purges (every 30s) back to 17.9 MB.
Process explorer shows the RAM usage a bit higher but the trending is there.
HWinfo only version also seems to have fixed the leak for me.
Main ModBros Monitoring service gets up to around 18 MB then drops back down.
I can report the same thing, my computer is open 24 7 and it was using 8gig of ram after 2 weeks LOL! (i have 32 so it just keep going..) i rebooted 2 days ago and now it's back upp to 1.2gig usage