Memory Leak in ModBors Monitoring Service

Just curious if you are aware that you have a memory leak in this service. It starts with 36MB of memory used, once it has been running a day it has already consumed nearly 2GB of memory. This left unchecked will consume most peoples available memory in a few days.
I think you might just be seeing that. I’m guessing dev team all have intel ?
Nope, still using my trusted Ryzen 1800X here ;)
But maybe we do have an issue with the newer Ryzen chips.. ?
Was this problem already there with older versions of MoBro or did this start with beta7?
This is the first version I have used. Happy to test with an older version though if you can provide access.
Same here, this is the first version I've used.
Out of curiosity, I've switched all my gauges to not use HWINFO. I'll let it run for a while and update tonight.
- Ally.
So, I ran a test. I uninstalled HWINFO, and changed all of my gauges over to libre hardware mon.
Interesting.
I tried to do the same and remove the reliance on HWinfo, but my boards Fan headers and UPS do not appear under open or libre.
I have HWINFO uninstalled and only rely on Open and Libre, and still experience the memory creep.
Thanks for testing!
Well I guess our assumption that this was caused by the HWiNFO integration was wrong..
We did have higher RAM usage when HWiNFO was running in our testing, so we assumed that it might be linked to this
But as I said it also always levelled off and stopped rising. In may case ~70MB
Our best bet currently is a leak in OpenHardwardwareMonitor. With beta7 we also upgraded the included OHM library that we ship to the most recent version (0.9.6)
The changelog only mentions “AMD family 19h (Zen 3) CPU support" which would align with the fact that all of you are using recent Ryzen CPUs
But of course we can not really test or verify this at the moment, as none of us is using a recent Ryzen CPU and on my 1800X everything runs fine.
I'll build a version of the service with OHM disabled today or tomorrow for you guys to test. So we can check if that's indeed the problem or if we have to keep searching elsewhere.
I can't say I noticed the mem leak since the one I reported mid last year (v4/v5 maybe).
Always happy to test.
I run a pretty simple config, so I'll switch all my stuff to Libre and see if the issue persists.
I see a constant tick of .1 - .3 MB/sec growth from boot.
20hr uptime.
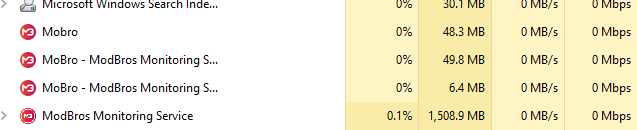
I am using the OpenHardware info.
I love the MoBro software. I am no programmer but just let me know if I can do anything to help track down the memory issue.
I run a pretty simple config, so I'll switch all my stuff to Libre and see if the issue persists.
Really appreciate the effort, but sadly that won't help. The way the app currently works, it will still pull data from OpenHardware, even if none of those values are currently displayed.
For HWiNFO that's different, since there is no data to pull if HWiNFO is not running.
That's why I have to specifically build a version with OpenHardware disabled to test that.
We have already plans to rebuild the service in a more modular form so only data that is actually displayed will be read. But that will still take quite a while until it's done.
Alright, so I've now created 2 modified versions of the service. One has OpenHardwareMonitor disabled, the other one LibreHardwareMonitor.
You can find both of them here.
Replacing the existing service is pretty easy:
- Stop the running service (Just open ‘Services’ in Windows and stop the ‘ModBros Monitoring Service’)
- Go to ‘C:\Users\<USERNAME>\AppData\Local\MoBro_Local\’
- Make a copy of the ‘ModBrosMonitoringService.exe’ so you can switch back to it later on if you need to
- Replace the ‘ModBrosMonitoringService.exe’ with the modified version you downloaded
- Restart the service
Would be nice if some of you could test this and report back if disabling any of the 2 plugins solves the memory problem for you.
Perfect. Grabbed both. Starting with “Open Disabled” version.
Just realized that I missed to disable some of the initialization code of the plugins?♂️
I've replaced the uploaded services.
@MrSpoon could you please re-download and test with those?
You were just a tad to quick for me to correct my mistake in time
No problem. Updated. Will report back.
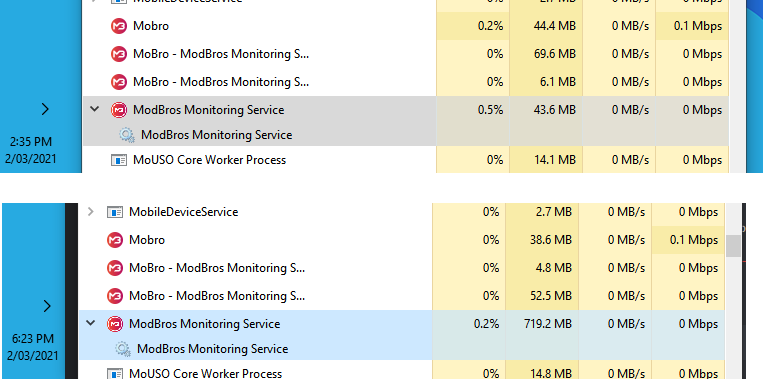
3 hrs of "Open Disabled and still over 100MB and climbing

Tried both edited services but the same slowly-but-steadily increasing memory usage showed for each.
I wanted to get a longer run in.
14 hrs in on “Open Disabled” and hit over 700MB.
Now trying “Libre Disabled”…
During the initial run my pi3 was connected for only the first few hours then it failed out with a different issue. So 12ish hrs was nothing but the service running.
Hate to say it but “Libre” version is upto 340MB…
Well, that doesn't sound that good..
I've uploaded an old previous version of the service now as well to check if this problem only occurs in the new one or was already present back then.
And just to definitely rule out the unlikely case that there's an issue with both Open and Libre Hardware Monitor , I also created a service version that has only HWiNFO enabled.
You can find them here like the previous 2 versions.
Thanks a lot for helping us with this issue!